
Sometimes you hit a bug and your brain just goes, “huh.”
That was me earlier this week while trying to figure out why Drupal’s JavaScript was completely broken. But only on one page. And of course, this happened during a live demo!
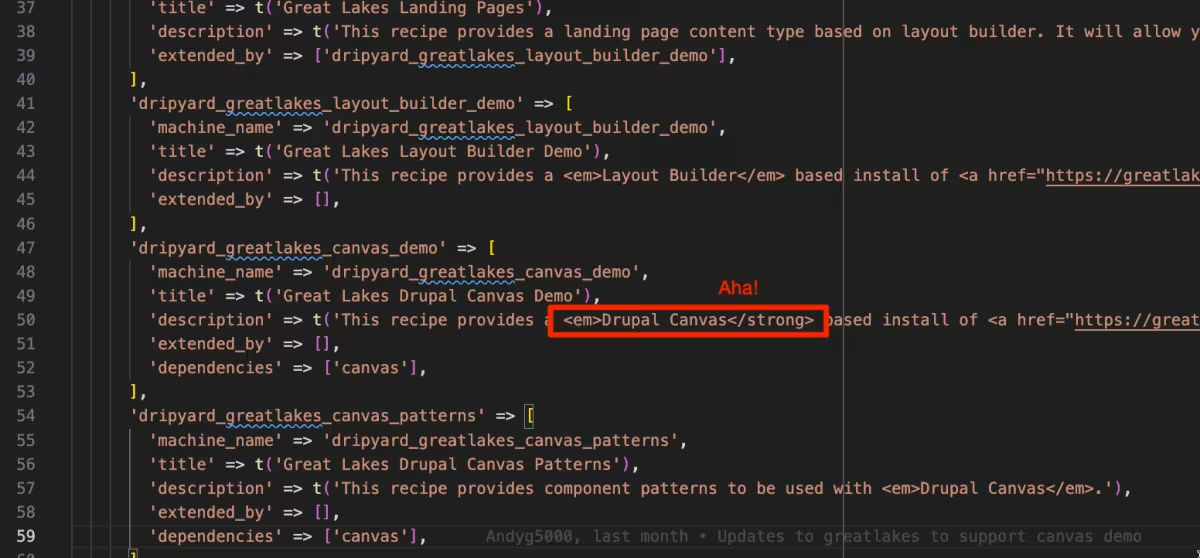
You can actually see the moment it went sideways here. This is the story of how I tracked it down.
The problem
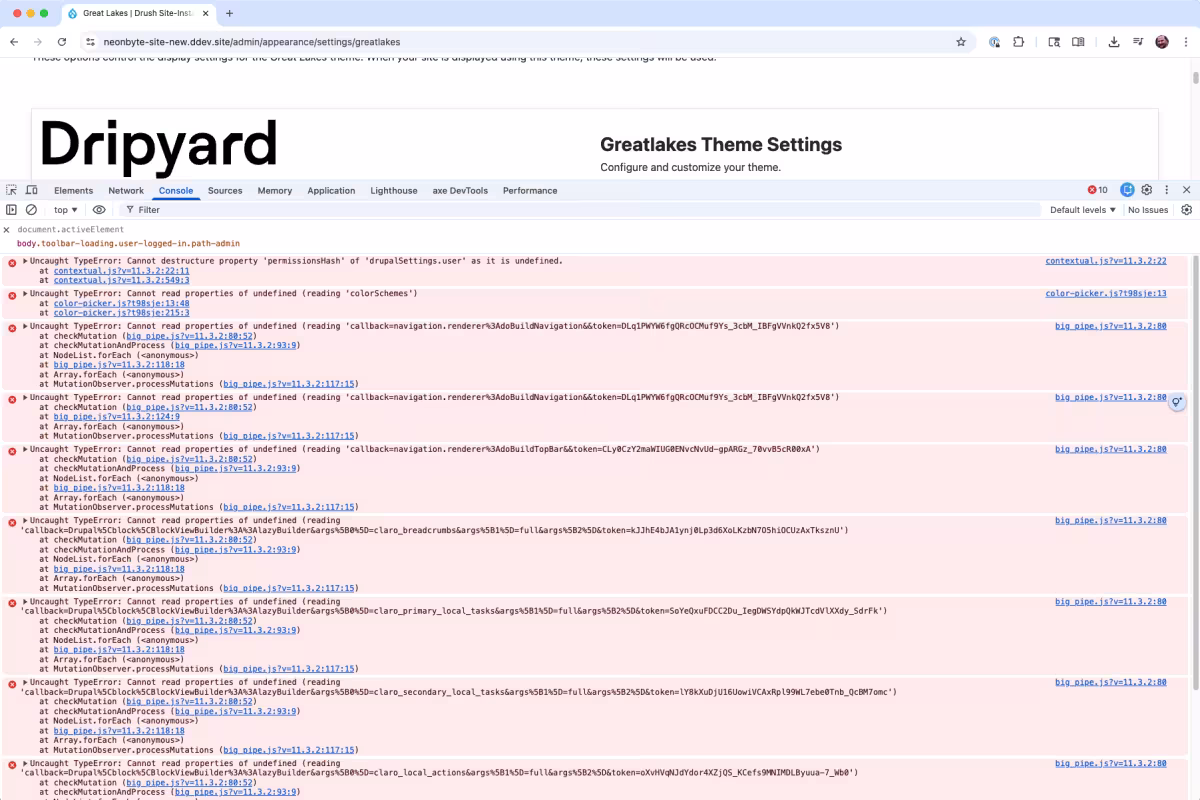
Dripyard adds a bunch of options to our theme settings pages. On one particular theme, Great Lakes, the settings page was loading with JavaScript absolutely wrecked.
Totally broken. No behaviors. Console full of errors. Not ideal when people are watching you.
What made this extra confusing was that it only happened on this one page, and only for this one theme.
Process of elimination
Through testing, I knew that this only happened on one page, and for one theme (Great Lakes).
Normally the console points you directly to the problem. This time it didn’t. So I went into full process-of-elimination mode.
We inject a little JavaScript for the color selector, so that was the first thing I nuked. I commented out all of it. No change.
Next I noticed a wall of BigPipe-related errors. Aha moment. BigPipe recently switched to HTMX. Surely this was a core bug, right?
I uninstalled BigPipe.
Nope. Still broken. But, at least the console was quieter now.
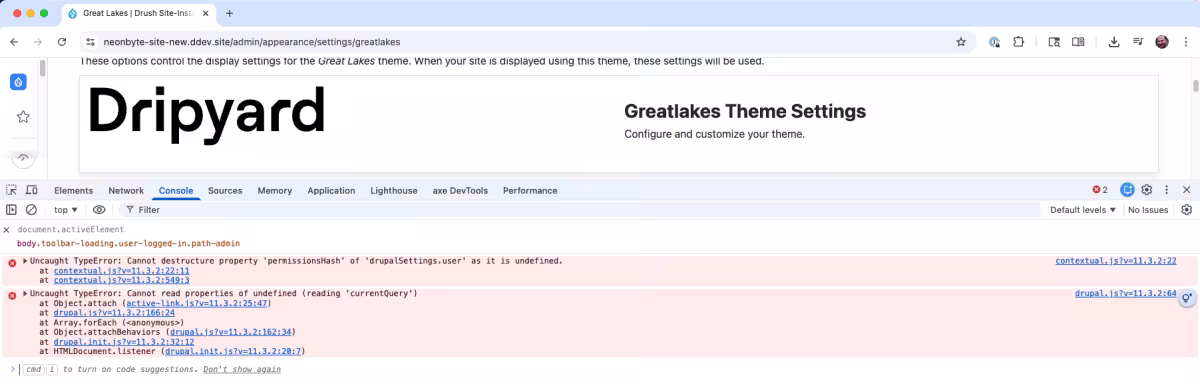
The errors were
Uncaught TypeError: Cannot destructure property 'permissionsHash' of 'drupalSettings.user' as it is undefined. at contextual.js?v=11.3.2:22:11

Uncaught TypeError: Cannot read properties of undefined (reading 'currentQuery') at Object.attach (active-link.js?v=11.3.2:25:47)
Debugging (with a quick how-to)
If you’re not familiar with in browser JavaScript debugging, you should learn it. It’s fun, and it helps you learn and easily debug.
I started looking at active-link.js first to see what’s breaking.
To do so, I clicked on the link to active-link.js and set a breakpoint by clicking the line number. I know the breakpoint is set, because the line number is highlighted with a blue flag. I then reloaded.
The browser will pause execution of JavaScript at that point and I could now inspect the variables.
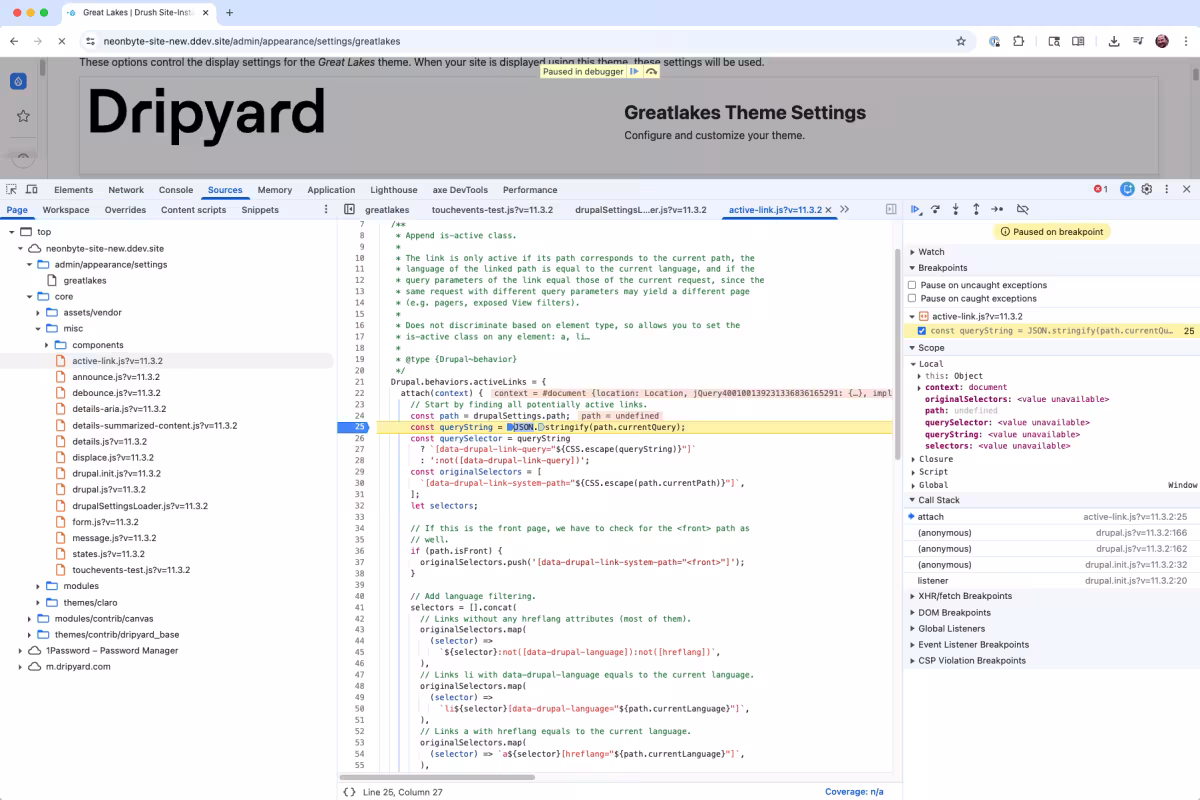
That’s when I saw the problem. drupalSettings.path was undefined.
What’s drupalSettings?
drupalSettings is how Drupal passes data from PHP to JavaScript. It does this by embedding a JSON blob inside a <script> tag right before the closing </body>.
So, I go into the console and type drupalSettings (fun fact, you can do this on any Drupal site).
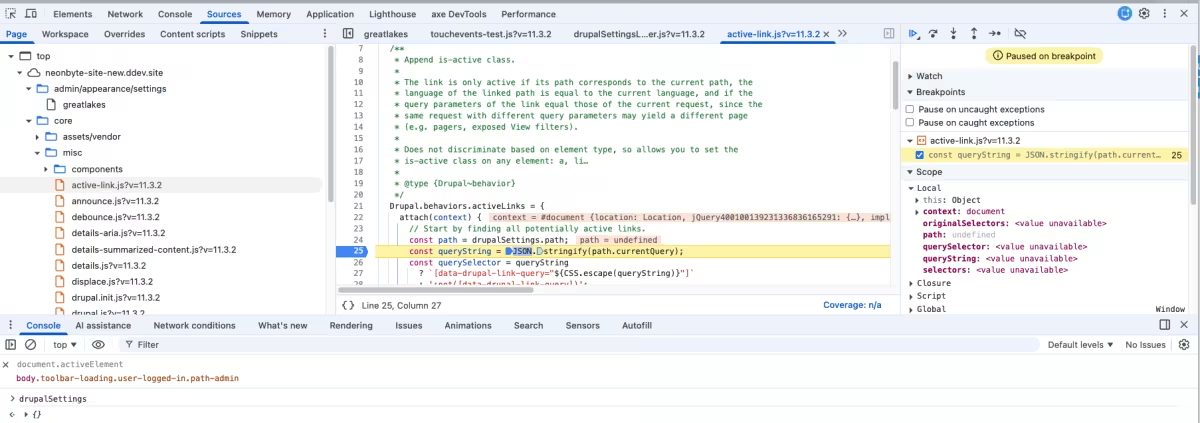
It was empty!! What the hell?!
I viewed the page source to double-check, and sure enough, the drupalSettings script was right there in the HTML.
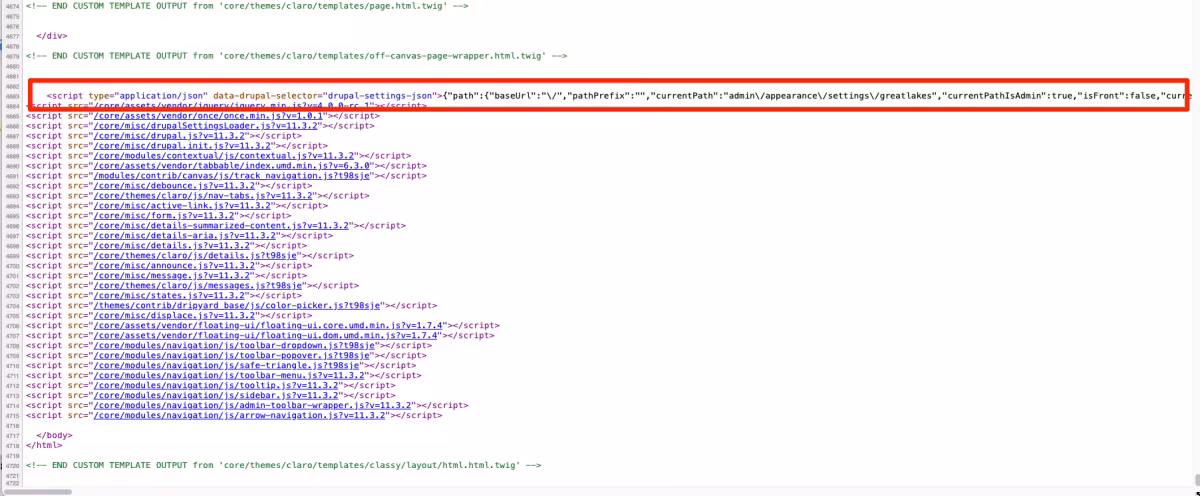
It’s RIGHT THERE! What's going on here?
Diving deeper
At this point I needed to see how drupalSettings actually gets loaded. Most of Drupal core’s JavaScript lives in /core/misc, and sure enough, there’s a file called drupalSettingsLoader.js.
This file is about as straightforward as they come.
/**
* @file
* Parse inline JSON and initialize the drupalSettings global object.
*/
(function () {
// Use direct child elements to harden against XSS exploits when CSP is on.
const settingsElement = document.querySelector(
'head > script[type="application/json"][data-drupal-selector="drupal-settings-json"], body > script[type="application/json"][data-drupal-selector="drupal-settings-json"]',
);
/**
* Variable generated by Drupal with all the configuration created from PHP.
*
* @global
*
* @type {object}
*/
window.drupalSettings = {};
if (settingsElement !== null) {
window.drupalSettings = JSON.parse(settingsElement.textContent);
}
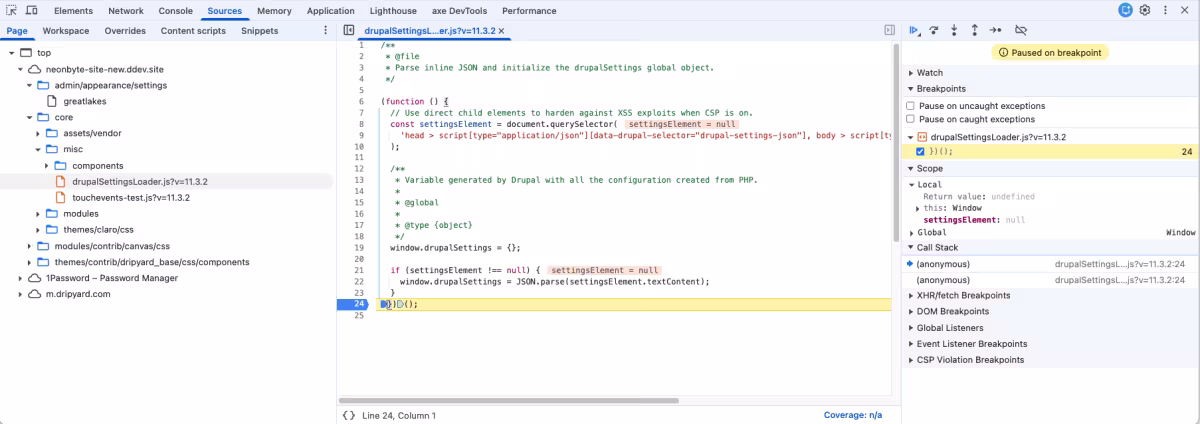
})();So at this point, I opened up that file in the Chrome’s Developer Tool’s “Source” tab. You can easily do this by hitting CMD + P, and typing in the filename.
I set a breakpoint at line 23, to see if it the object was loaded. Sure enough it did not. The loader script couldn’t find the <script> tag it was looking for.
I saw that the settingsElement variable is set to the following CSS selector:
head > script[type="application/json"][data-drupal-selector="drupal-settings-json"],
body > script[type="application/json"][data-drupal-selector="drupal-settings-json"]
I know the JSON is in the body, so I copy the second line of the selector, go to the “Elements” panel in Developer Tools, hit CMD +F, and searched for it.
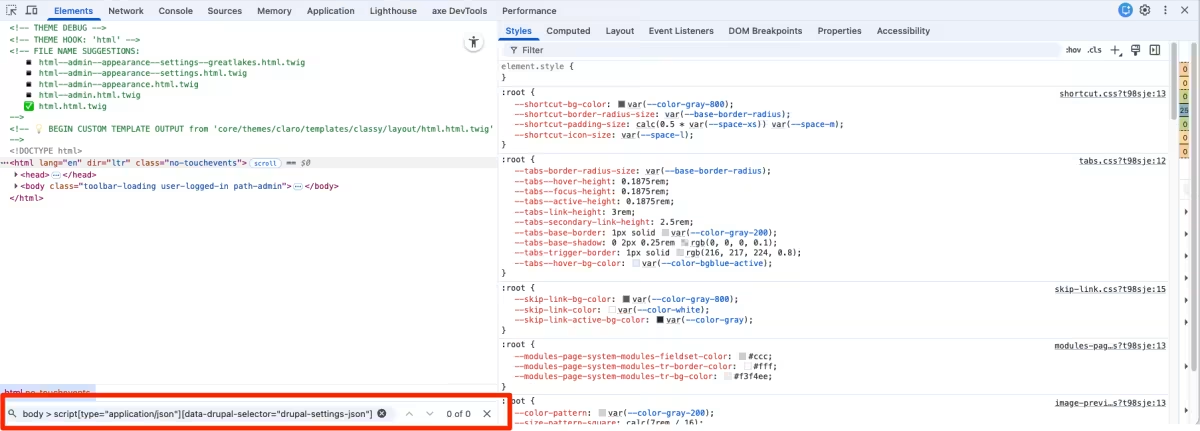
Zero results.
The real culprit
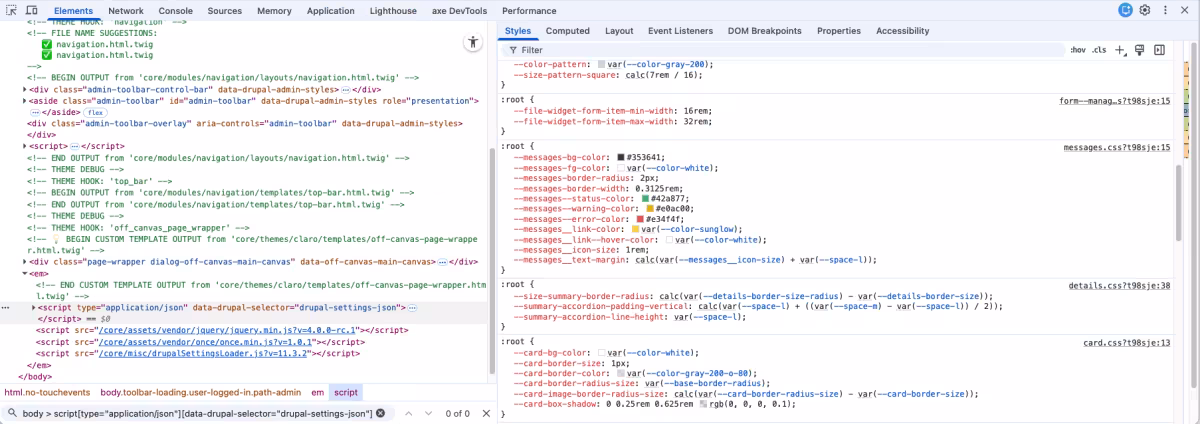
I scrolled down in the Elements panel to where the drupalSettings script lived. And there it was wrapped inside an <em> tag!
That <em> tag does not exist in the page source. But it does exist in the DOM. This is the important distinction. The DOM is not the same thing as the raw HTML. If you leave an HTML tag unclosed, the browser will do its best to fix things for you. Sometimes it guesses wrong.
I’ve seen this before. The DOM can get mangled up if there’s an unclosed HTML tag somewhere in the markup. And if you look at the selector that drupalSettingsLoader.js is using, the <script> needs to be a direct descendant of the <body> tag.
This was the problem. Because of the unclosed <em> tag mangling the DOM, drupalSettingsLoader.js couldn’t find the drupalSettings <script> tag.
Finding the mistake
Now that I knew what I was looking for, the fix was straightforward.
- It only happened on Great Lakes
- We do not use many
<em>tags
A quick search later, and there it was. One lonely, unclosed <em>. I properly closed the tag, reloaded the page, and everything immediately started working again.
So what did we learn?
This was definitely a “huh” moment, but I kind of love bugs like this.
Takeaways:
- Simplifying the problem is huge. Removing our JS and BigPipe helped narrow the search fast
- DevTools show you the DOM, not the original HTML. That difference matters
- Knowing how Drupal works helps you debug faster and with more confidence
- Even tiny markup mistakes can have massive side effects
Also, maybe do not do a live demo after making changes to your code..